
Stock Market Outlook: 10 Key Insights before opening bell : NIFTY 50 Trade Setup
Date : 13 Feb 2025
Also read click here
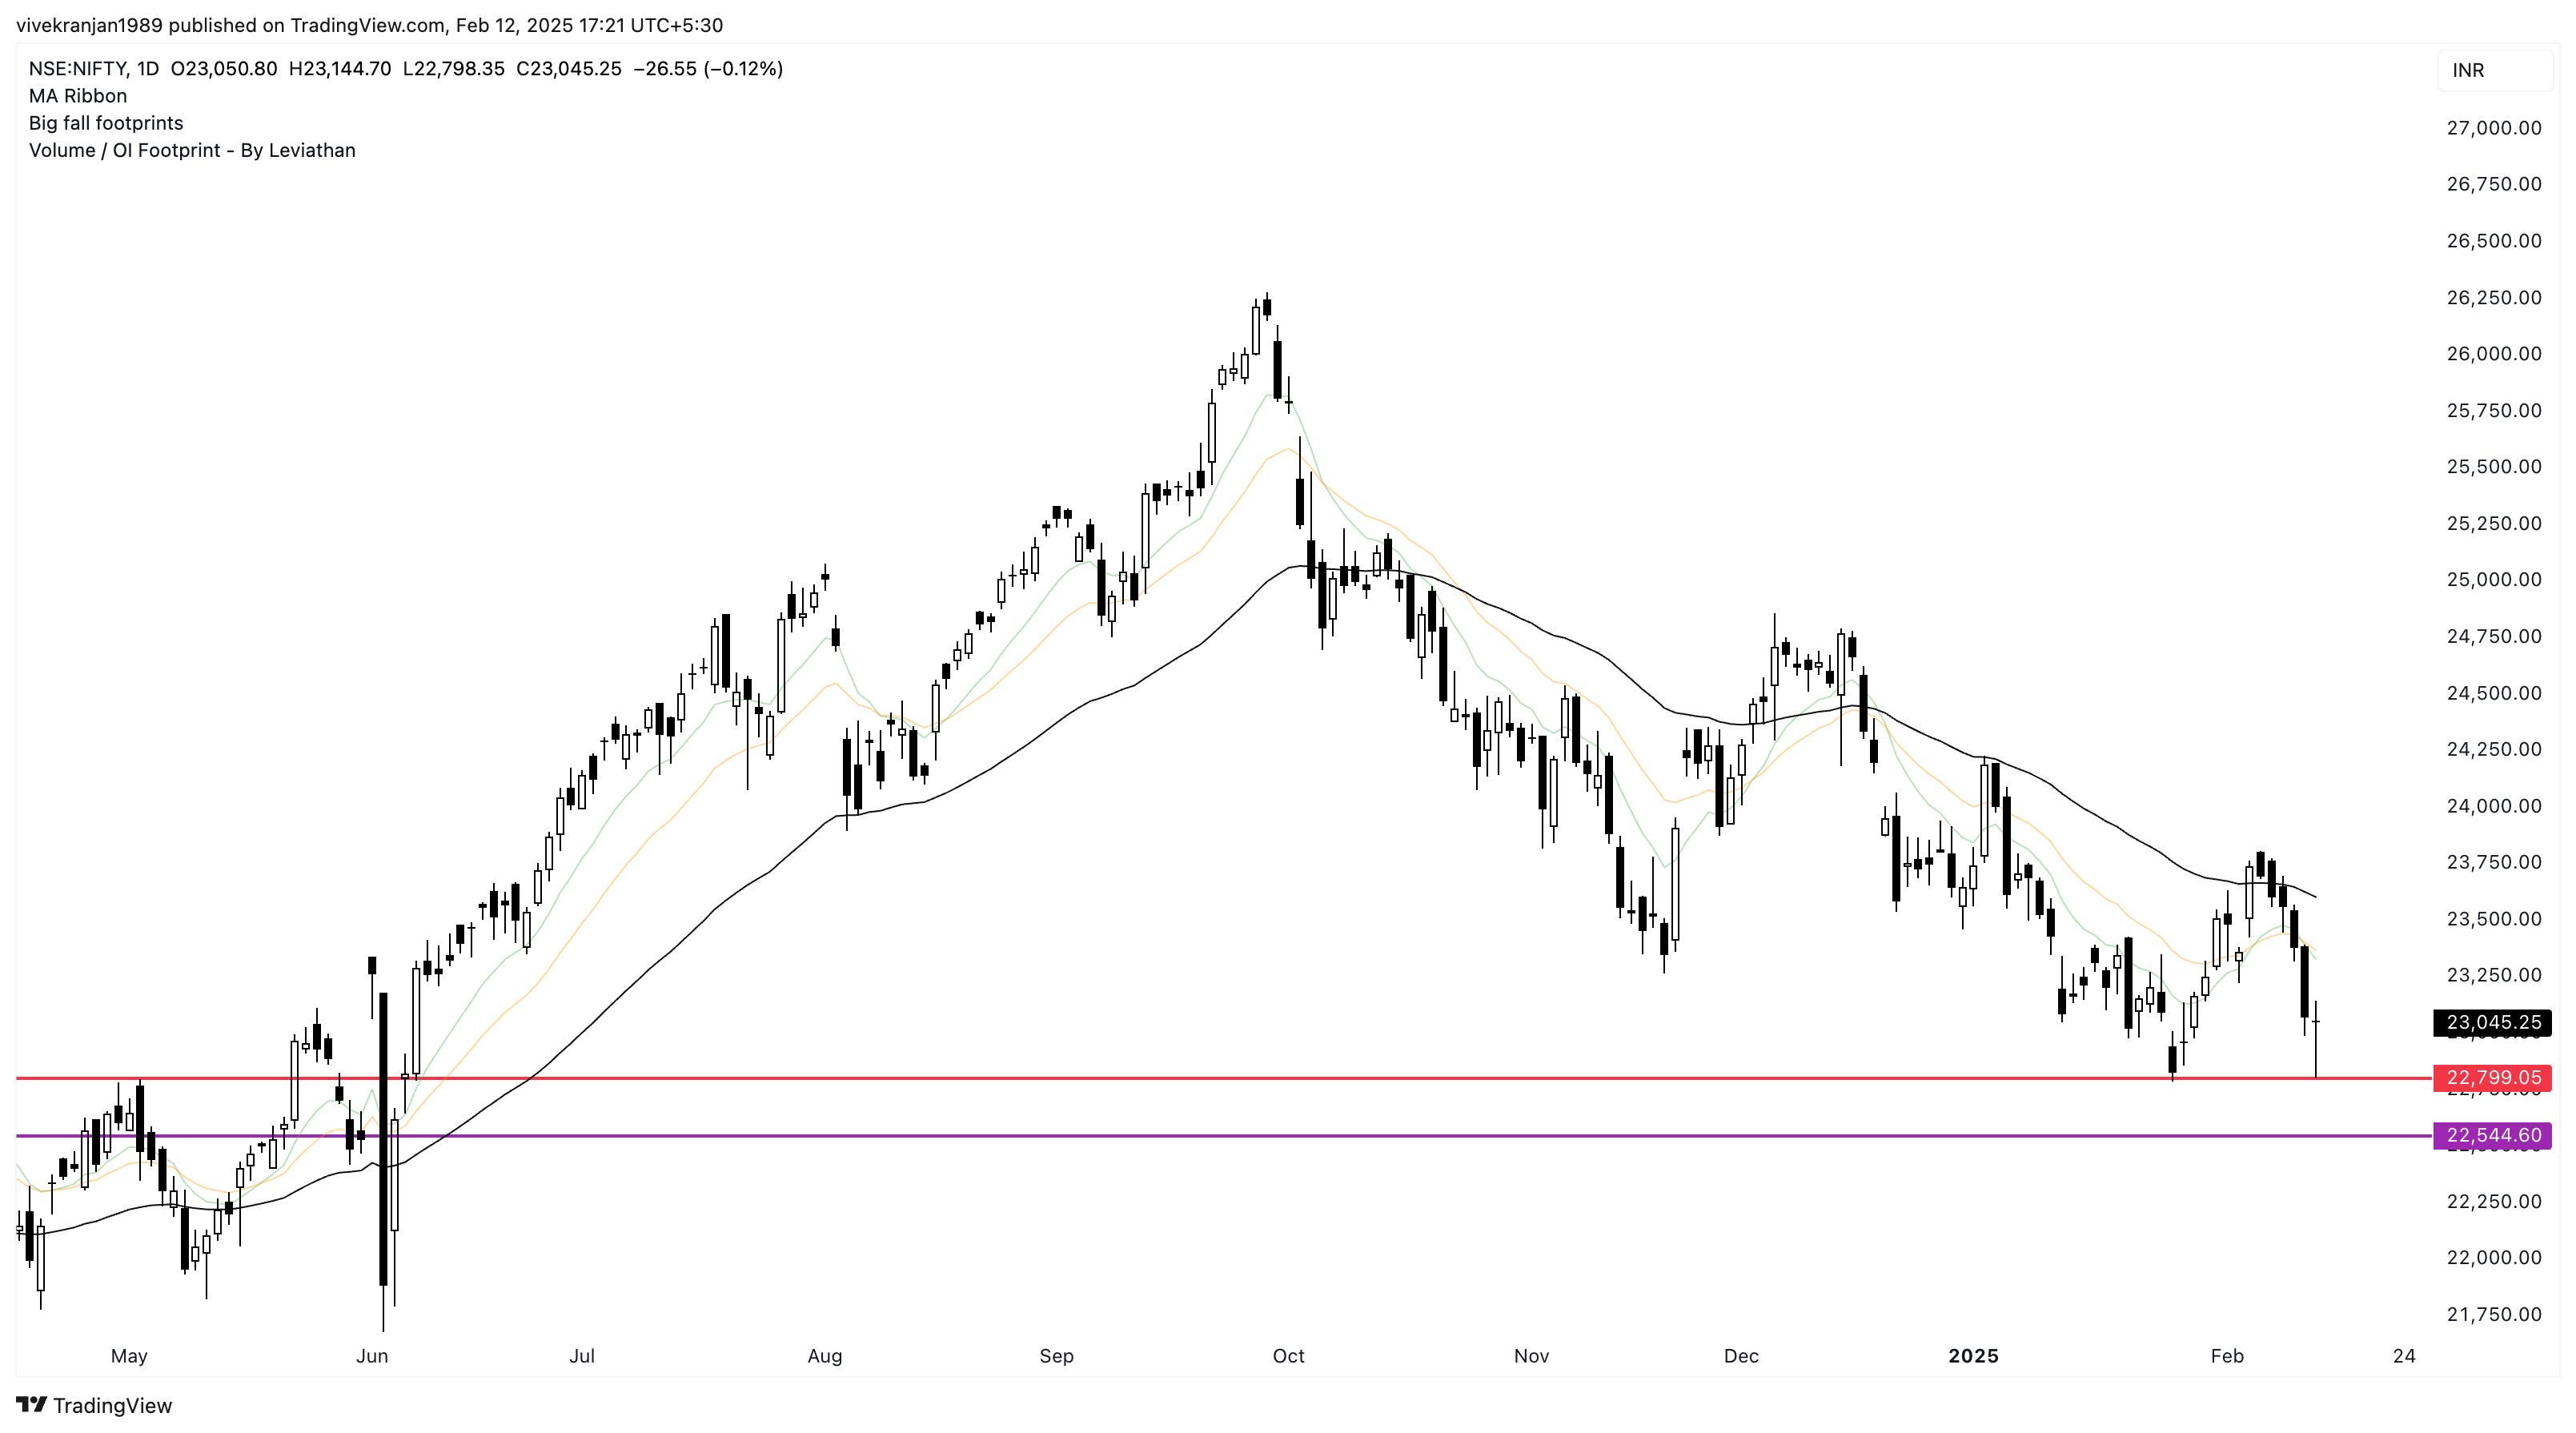
The Nifty 50 showed some recovery on February 12, bouncing back by nearly 250 points from its intraday low of 22,800, which was close to its January low. Despite this rebound, the index still closed slightly lower, marking its sixth consecutive losing session.
The trend of making lower highs and lower lows continued for the fifth straight day, highlighting ongoing market weakness. Interestingly, the index formed a Long-Legged Doji candlestick pattern on the daily chart. This pattern reflects market indecision between buyers (bulls) and sellers (bears), but it also hints at a potential bottom reversal if momentum shifts.
Normally, formations like the Long Legged Doji pattern after a reasonable decline indicate chances of a bottom reversal post-confirmation
Here are 10 key insights we’ve gathered to help you identify potential profitable trading opportunities:
1. Nifty 50 Chart
2. Nifty OI (Open Interest)
Open Interest (OI) in the Nifty represents the total number of outstanding derivative contracts, such as futures and options, that have not yet been settled. It’s a crucial metric for analyzing market sentiment, trends, and potential price movements in the Nifty index.
Key points about Nifty Open Interest:
- Rising OI with Rising Price: Indicates fresh buying or bullish sentiment.
- Rising OI with Falling Price: Suggests fresh selling or bearish sentiment.
- Declining OI with Rising Price: Reflects short covering.
- Declining OI with Falling Price: Implies long unwinding.

3. Max Pain & OI Buildup


4. Stocks Under BAN (MWPL) : These securities have exceeded 95% of the market-wide position limit (MWPL), leading to their inclusion in the ban list. During the ban period, traders are permitted to decrease their positions through offsetting trades but are restricted from initiating new positions in these contracts. The ban is lifted only when the open interest falls below 80% of the MWPL.

5. Nifty Moving Average Report

6. Bank Nifty Moving Average Report

7.Nifty Buildup Report : Nifty buildup analysis is a way to assess market sentiment by analyzing open interest (OI) and price movements.

8. Nifty Gainers/Losers Report : Nifty Gainers and Losers” refers to the stocks within the Nifty 50 index that have experienced the highest gains (gainers) or the largest declines (losers) in their stock prices during a specific trading session.

9. Nifty Futures Open Interest

10. Nifty Bank Futures Open Interest

DISCLAIMER :
 The views and investment tips expressed by investment experts/broking houses/rating agencies on samvadmantra.com are their own, and not that of the website or its management. Investing in equities poses a risk of financial losses. Investors must therefore exercise due caution while investing or trading in stocks. samvadmantra or the author are not liable for any losses caused as a result of the decision based on this article. Please consult your investment advisor before investing.